🚨US Extreme Weather and Climate Change Dashboard
From the THB Extreme Weather and Climate Change DashboardBack in 1999, I published a paper in theBulletin of the American Meteorological Societywith Ken Kunkel and Stan Changnon titled“Temporal Fluctuations. . .
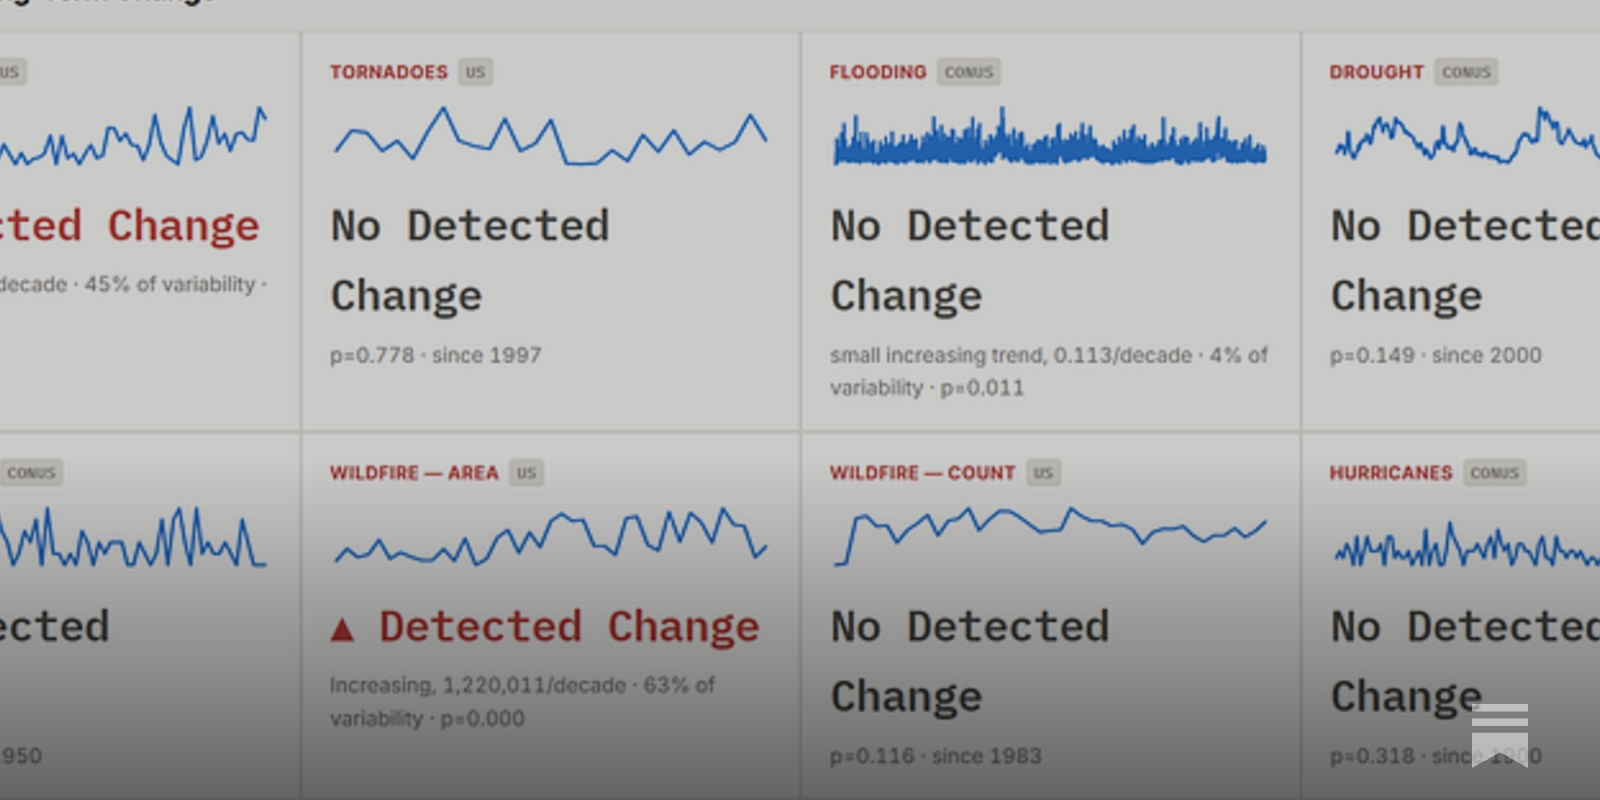
From the THB Extreme Weather and Climate Change DashboardBack in 1999, I published a paper in theBulletin of the American Meteorological Societywith Ken Kunkel and Stan Changnon titled“Temporal Fluctuations in Weather and Climate Extremes That Cause Economic and Human Health Impacts: A Review”. The paper looked at long-term trends in extreme weather in the United States based on the understanding that to understand whether climate has changed in ways that matter to people, you have to examine long-term, high-quality records of variable associated with the extremes that actually cause harm — and you have to try to distinguish any observed trend from the noise of internal variability. One of the US EPA official indicators of trends in US heat waves was based on our 1999 paper. The Trump administration deleted the EPA Climate Indicators website in 2025. But I’ve built a much better one. That paper included a time series of the frequency and intensity of heat waves across the United States which was adopted by the U. S. Environmental Protection Agency (EPA) as an official climate indicator, featured on the EPA’sClimate Change Indicatorswebsite. That resource no longer exists. In December 2025, the EPAremoved at least 80 climate-related webpages, including the Climate Change Indicators section that housed data on heat waves, coastal flooding, wildfires, snowfall, and droughts. Whatever you think about the politics, the removal took a widely used, taxpayer-funded reference — built on official data and years of careful analysis — offline. So I build a new and much better extreme weather and climate change dashboard, which I am releasing today. TheTHB US Extreme Weather and Climate Change Dashboardfollows theIntergovernmental Panel on Climate Change’s(IPCC) framework for detecting a change in climate in the context of internal variability. The dashboard tracks 32 variables across 7 types of extremes: heat waves, tornadoes, flooding, drought, winter storms, wildfire, and hurricanes. THB Extreme Weather DashboardA few principles guide the project:It relies on official data. The underlying records come from authoritative government and scientific sources. The dashboard presents the observational record based on the best available data. It respects the limits of the data. The site presents data only for the full range judged of sufficient quality for trend analysis. Users are empowered to explore the data over different time windows. Data and figures can be easily downloaded. It places the data into the context of the IPCC AR6. The dashboard follows the IPCC framework for detection and attribution and explains how the information presented is or is not consistent with the most recent assessment of the IPCC Working Group 1. Detecting a change in climate demands long records, attention to data quality, and an understanding of historical variability. The dashboard empowers users to look at the data themselves. Use this page to:learn the facts on trends in extreme weather in the U. S. ,hold the media accountable,find graphs and data to share online,elevate your game in debates about climate,and to jst explore some wonderful data from outstanding scientists and important organizations about this wonderful, complex world we share. From one perspective, this dashboard updates our1999 paperin which Ken Kunkel, Stan Changnon, and I sought to integrate data and research on trends in the extremes with the greatest societal impacts. The dashboard takes that same approach across seven phenomena and 32 variables, using the records we have now instead of the records we had then. That paper took a few years to complete — Using AI tools, I built this one in less than a month (again, thanks toRyan Mauefor the education!). I am surprised that no such dashboard exists. TheU. S. National Climate Assessment, with far more resources than I have available, could have created an ongoing, browsable set of extreme-weather indicators that anyone can explore. So could any number of research groups and agencies. Yet as far as I can tell, no one has. So I built it myself. This project remains a work in progress. I plan to add variables, refine sources, fix mistakes, and improve the presentation in collaboration with the readers of THB. If you spot an error, know of a better data source, or think a phenomenon deserves an indicator it lacks, tell me. Next up — a global dashboard!Suggestions welcome!Leave a commentSpread the word on the new dashboard by clicking that “❤️ Like” button. Appreciated!The US Extreme Weather and Climate Change Dashboard was created with the support of THB paid subscribers. Thank you for making this possible!Please consider an upgrade to a paid subscription to support THB!PS. Check out thenew landing pagefor all of my work.