Weather Forecasts Are Connecting Hot Days to Climate Change
So far, most of those efforts have centered on trying to prove the connection between the most extreme weather and climate change, like theblistering heat domethat settled over the Pacific Northwest last. . .
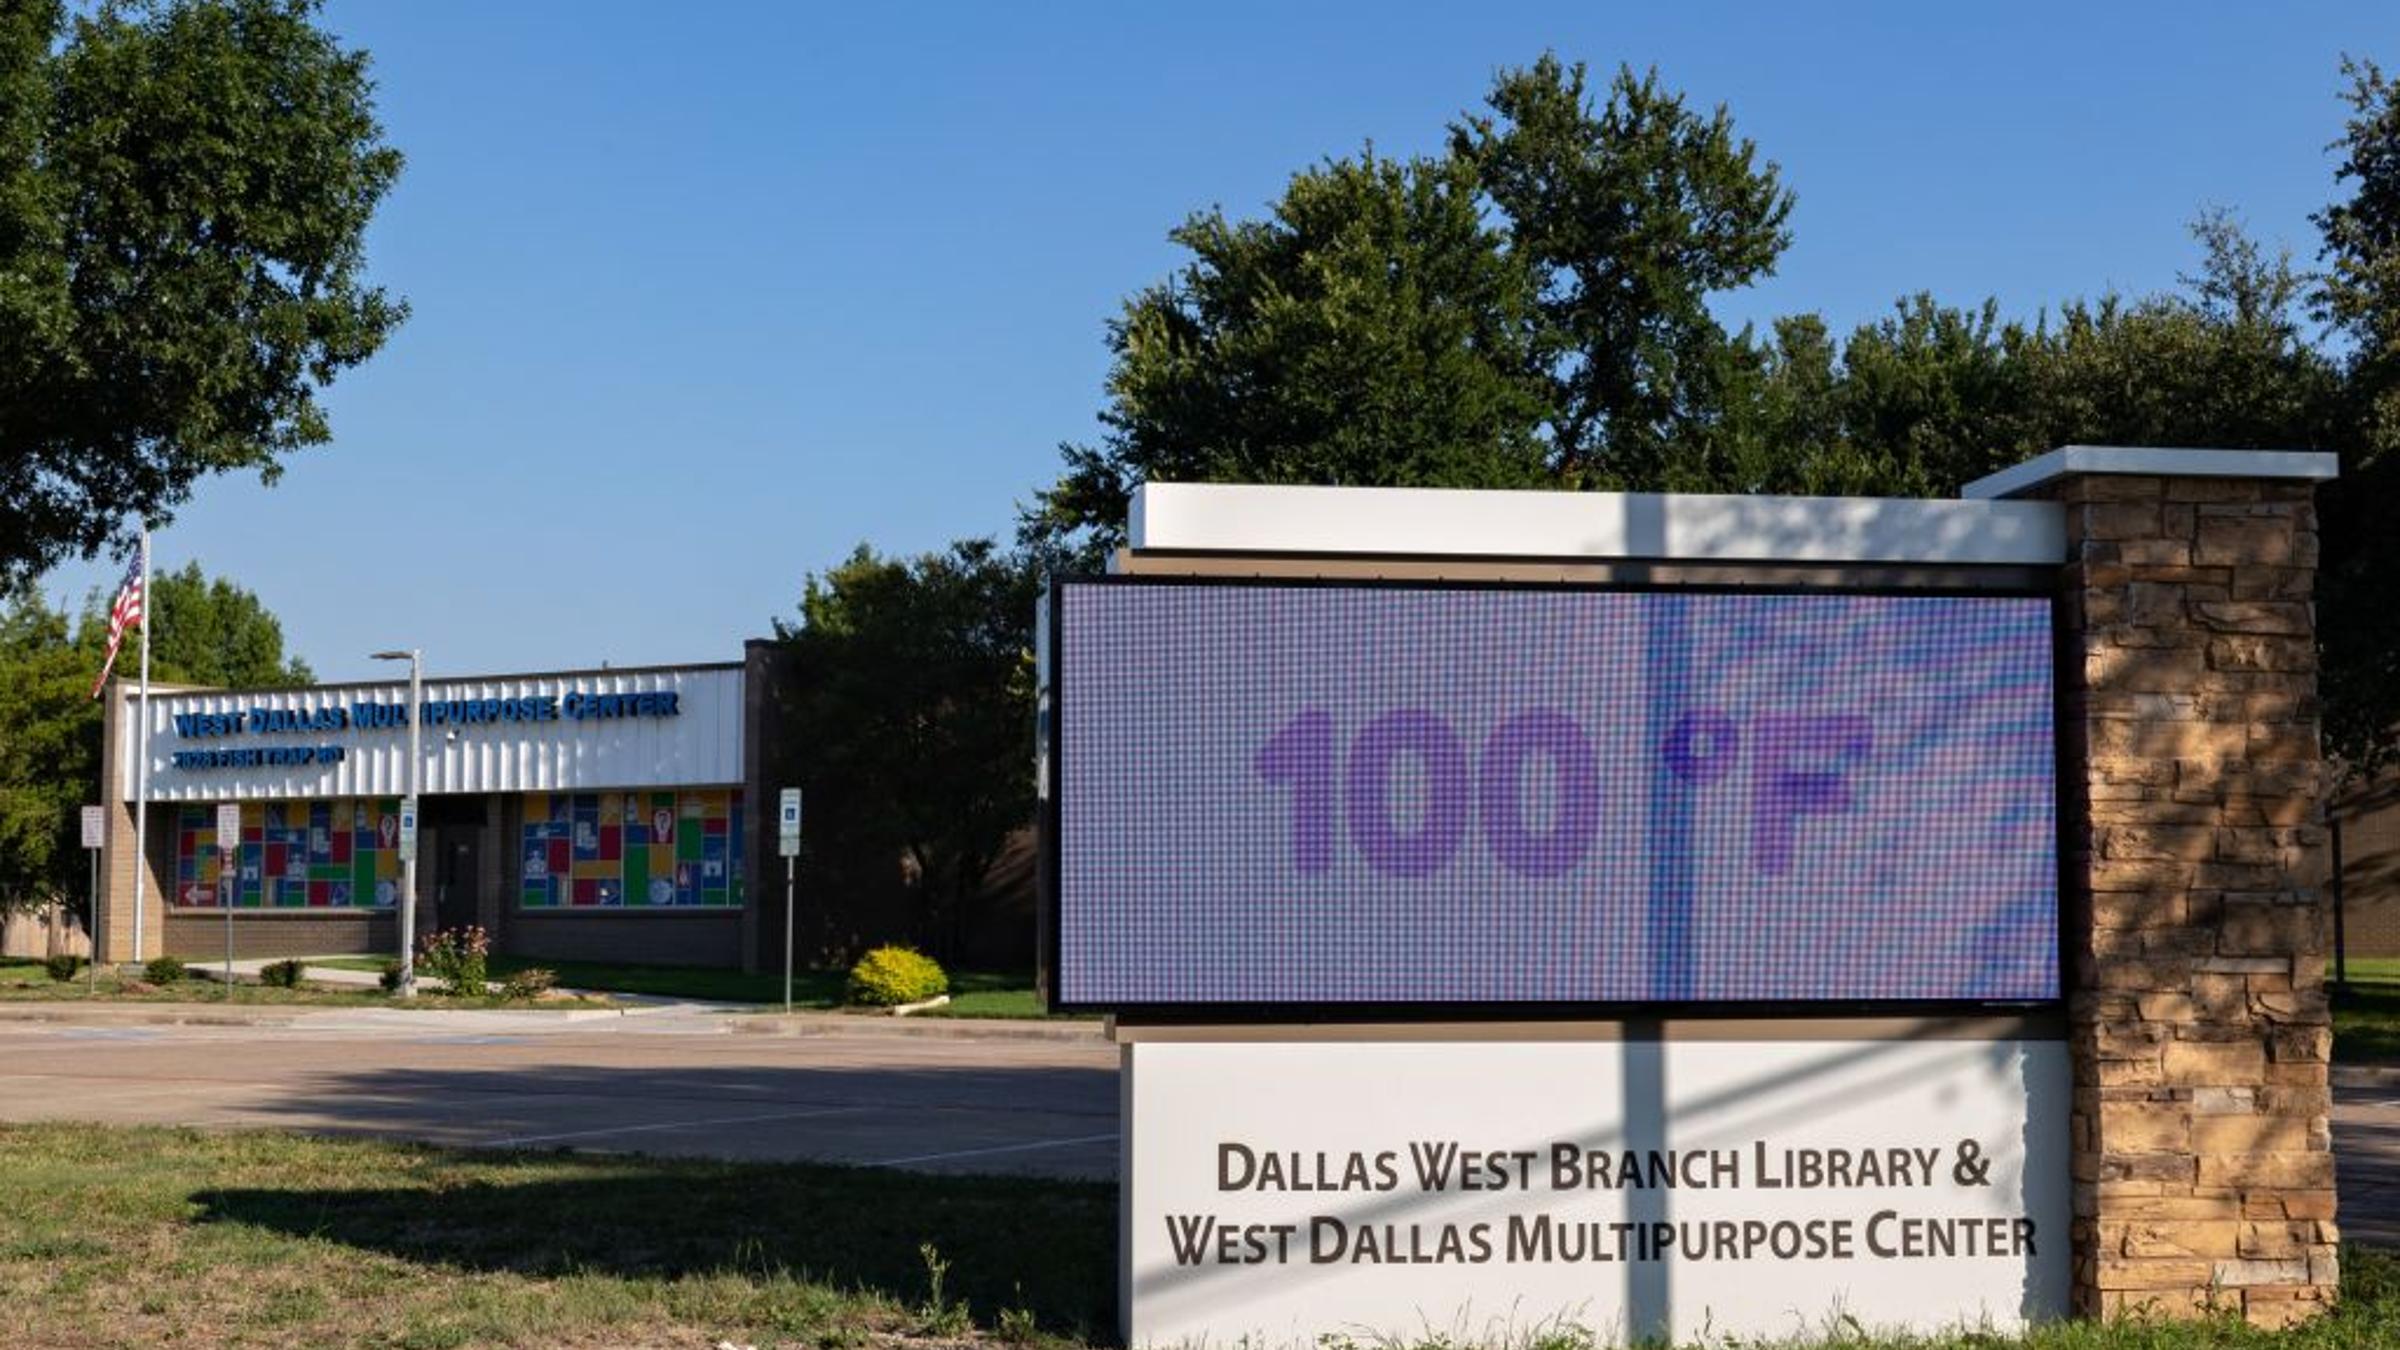
So far, most of those efforts have centered on trying to prove the connection between the most extreme weather and climate change, like theblistering heat domethat settled over the Pacific Northwest last year, which scientists showed would have been virtually impossible without human-caused climate change. Climate Central’s effort is a bit different, though. Their work, led by Pershing, focuses on trying to show if and when climate change has an effect on everyday weather around the U. S. Every day, an automated system compares the weather around the country with historical data and the output of 24 different climate models. The result shows if climate change made the day’s weather in different regions more likely, and by how much. For instance, models showed that atmospheric CO2 made Houston’s 105°F heat five times more likely on July 10, the day of Arango’s forecast, the most extreme metric on the Climate Shift Index. The model can also show if climate change made an event less likely, like an unusually cool day in the middle of the summer. “These are the conditions that your kids or your grandkids might not experience,” says Pershing. Climate change can certainly make some unusual weather more than five times more likely. But the Climate Shift Index is less about illustrating the full picture of how warming affected the most extreme events than showing if climate played a part at all. It’s a more straightforward job, mathematically speaking, than trying to illustrate something like the “virtually impossible” conclusion from the Pacific Northwest heat dome last year, which is what lets the Climate Shift Team run the analysis across the entire continental U. S. every day. The new system brought some interesting conclusions when scientists retroactively analyzed weather data from recent months. December 2021, for instance, was “remarkably weird,” according to Pershing, with a clear climate change fingerprint on balmy temperatures across much of the upper midwest. But even though climate change can have a sizable effect on winter temperatures, people are less likely to associate that knowledge with the need for urgent climate action—namely, because while warm winter days can feel strange, a lot of people don’t necessarily mind a break from freezing temperatures. Summer heat waves, on the other hand, are when people tend to register the multifaceted dangers of climate change, which was why the Climate Central team raced to finish work on the Climate Shift Index before thehottest days of the summerrolled around. They hit a snag over Christmas break last year—their calculations were running too slowly, and it looked like they might not have the system ready by summer. Some clever software engineering, though, managed to speed the whole process up. Now, with a handful of weather forecasters starting to incorporate maps and information from Climate Central into their programs, the hope is that the climate shift index becomes another piece of standard knowledge that people look for in weather reports, like humidity and chance of precipitation. “It’s not like you’re going to take your climate change umbrella out,” says Pershing. “It’s telling you that these are the conditions that are going to be more common in your future. These are the ones that we need to prepare for. ”